
Oil’s Turn in the Commodity Cycle
What lower interest rates, related commodity price increases and oil’s lag mean for energy equities in 2026.

Since launching Bison Insights, the seven investment ideas I’ve published have performed well versus the broader energy market, as measured by the XOP energy ETF:
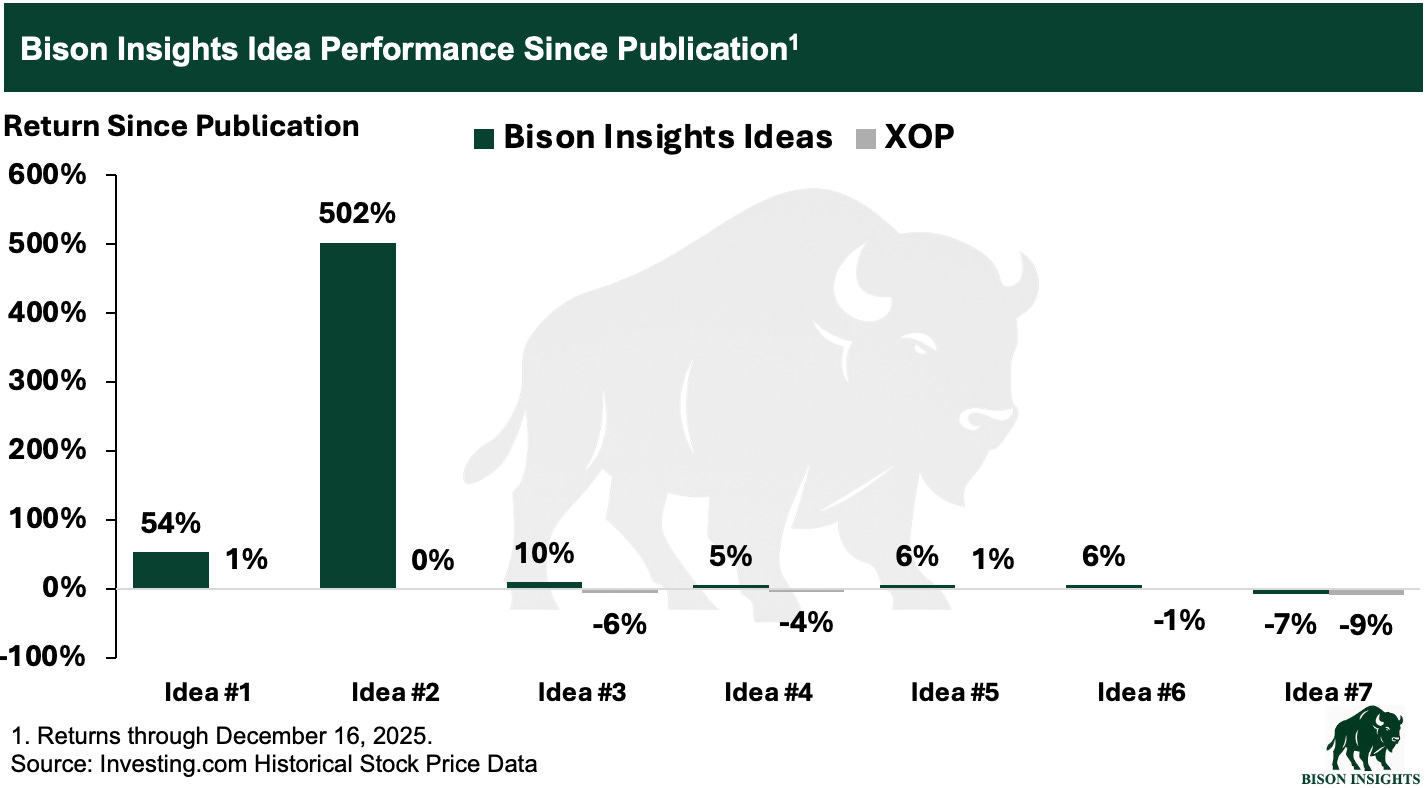
For readers who want full access to future write-ups and ongoing research, I’m currently offering a holiday promotion with 50% off subscriptions.
What comes next for these stocks, and others I plan to write about, in 2026?
Historically, the best time to buy oil equities has been when oil prices are depressed and sit below the marginal cost of supply, as they do today near their lowest levels in nearly five years.
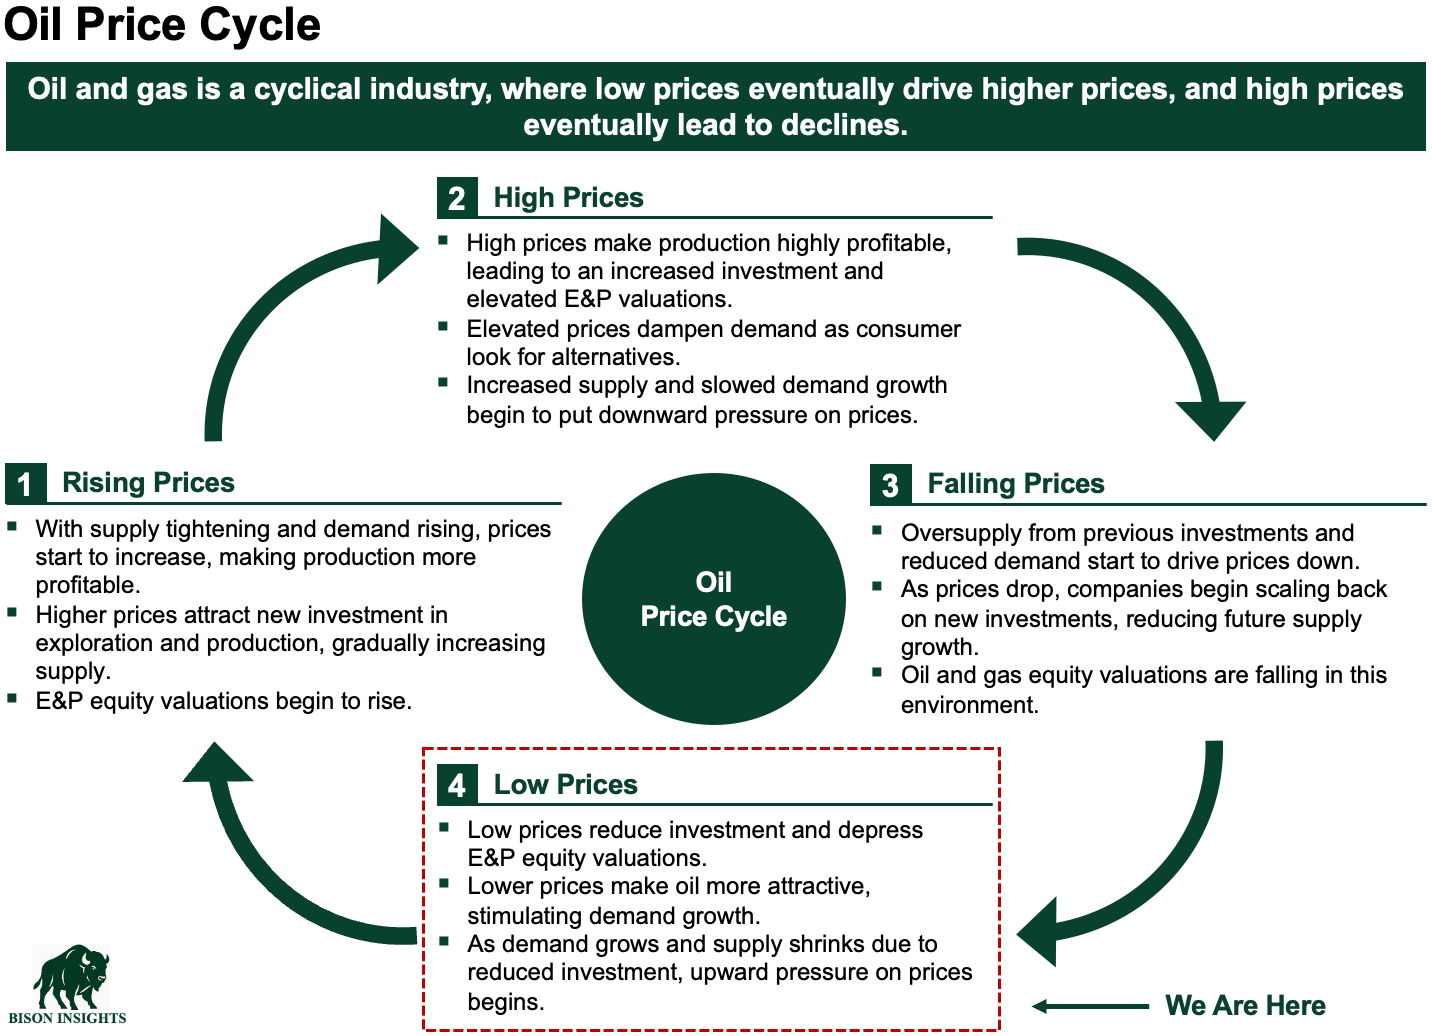
The reason is structural. Production from oil wells naturally declines over time. To keep production flat or grow it, operators must drill new wells. If oil prices are not high enough to justify the cost of drilling, operators simply do not drill (with limited exceptions for holding acreage, which represent a small share of activity and do not drive overall production trends).
When drilling slows, production growth stagnates or reverses. Demand, however, continues to grow gradually with increased global economic activity. Over time, this creates a widening gap between supply and demand, and prices must rise so that production can “catch up” with demand.

This dynamic leads to bi-modal oil pricing. Periods of low prices discourage investment and destroy future supply, setting the stage for eventual shortages. Prices are then forced higher (and they often go much higher) to incentivize the drilling needed to rebalance the market. In turn, those higher prices eventually attract new supply, restarting the cycle. Hence the familiar saying:
“The cure for low prices is low prices, and the cure for high prices is high prices.”
On the demand side, several charts from Against All Odds Research highlight historical patterns that can be useful for thinking about commodity and energy markets. Understanding the fundamentals that have driven these patterns can help investors understand what they signal for the period ahead.
Commodity Index and the Yield Curve
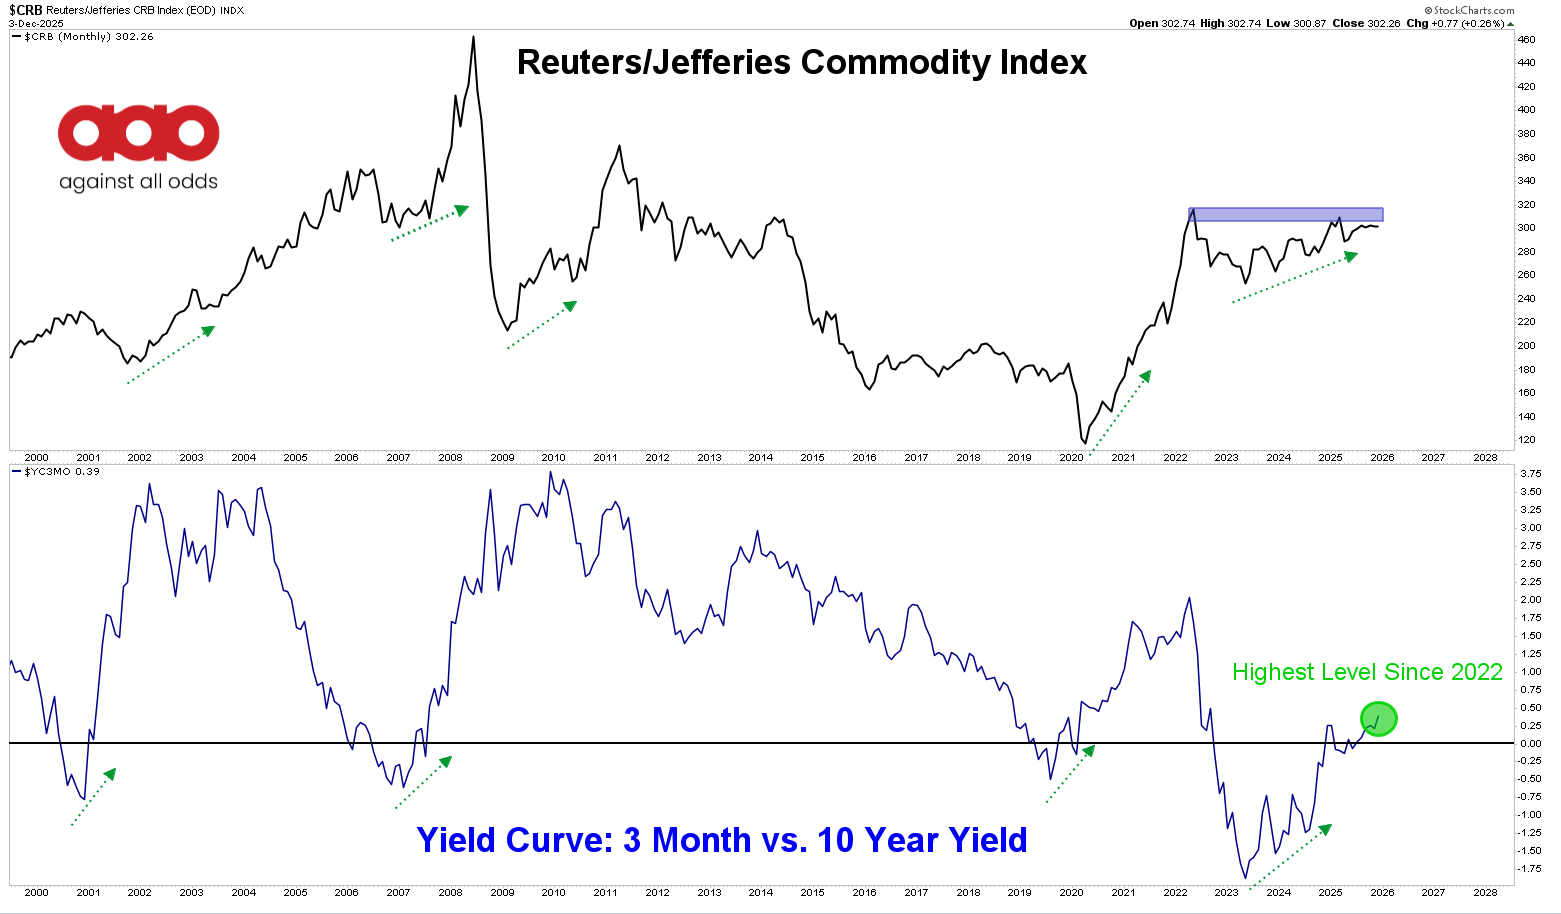
The chart above compares a broad commodity index with the yield curve. The yield curve has recently begun rising, and historically the two have often moved together. Why?
The yield curve is the long-term interest rate minus the short-term interest rate. When the curve is increasing (“steepening”), as it is now, it means short-term rates are falling relative to long-term rates as policy becomes less restrictive. Easier financial conditions support economic activity in the near term, which improves demand for commodities like oil, gas, copper, steel and other industrial inputs. Improved demand for these commodities supports higher prices for them.
Now, the Fed appears to be “running the economy hot,” recently bringing interest rates down to roughly 3.6%, the lowest level in three years. This shift toward easier policy should support economic growth as we head into 2026 and, as a result, increase demand for commodities such as oil and natural gas.
Sequencing Within the Commodity Cycle

Within the commodity index, a compelling historical correlation exists between gold, copper, and oil, where gold has often moved first, followed by copper, and then oil.
That pattern exists because gold, copper and oil tend to respond to different stages of the same economic cycle, each reflecting a distinct underlying driver.
Gold often moves first because it is a monetary asset. Falling interest rates reduce the opportunity cost of holding gold and raise inflation concerns, supporting higher prices, which is the dynamic we are seeing today.
Copper typically follows because it is tightly linked to industrial activity. When interest rates fall, financing and growth expectations improve, and investment in construction, manufacturing and infrastructure picks up, which is reflected in higher copper prices.
Oil often lags because it is tied to realized economic activity rather than expectations alone. Demand for oil rises as industrial activity, transportation and global trade actually accelerate, a process that typically lags interest rate cuts by several quarters. Oil demand also receives an incremental boost as mining and processing of industrial metals like gold and copper increases, both of which are highly energy intensive.
Why This Matters for Energy Equities
Interest rates are falling, and both gold and copper have recently reached all-time highs. As we head into 2026, these fundamental drivers for stronger oil demand appear to be firmly in place. Yet, oil prices are lagging. When prices recover, as they eventually must to incentivize the production needed to offset declines and to meet growing demand, cash flows expand rapidly and valuations rerate.
That dynamic is especially powerful for smaller oil producers and energy services companies like the ones I write about in this newsletter, where modest price changes can have an outsized impact on free cash flow and equity value. Higher prices are ultimately required to bring new supply online, and the further we trend below the price needed to grow supply, the more attractive the entry point gets.
Disclaimer: This is for informational and educational purposes only. This is not an offer, solicitation, or investment recommendation. Please consult an advisor and do your own diligence. Past performance may not repeat itself. These are the personal views of Josh Young’s alone, and do not represent any other individual or organization.