

“When the time comes to buy, you won’t want to” - Walter Deemer
A rare bullish oil market indicator just flashed “buy”. This has only flashed a few times over the past two decades, with each prior episode followed by strong oil price and oil equity performance.
It is somewhat similar to the unofficial “Economist indicator.” The Economist has had some notably wrong calls around major oil turning points, including “Drowning in oil” in 1999, “The end of the Oil Age” in 2003, and “Is it the end of the oil age?” in late 2020. Each came near a low point in oil sentiment and was followed by a significant rise in oil prices and oil equities.
More recently, The Economist published a bullish oil cover story in early May when oil prices were above $100 per barrel, after which oil prices have fallen by over 30%. Then last week, The Economist published “We woz wrong about oil.” Could this mark the bottom?
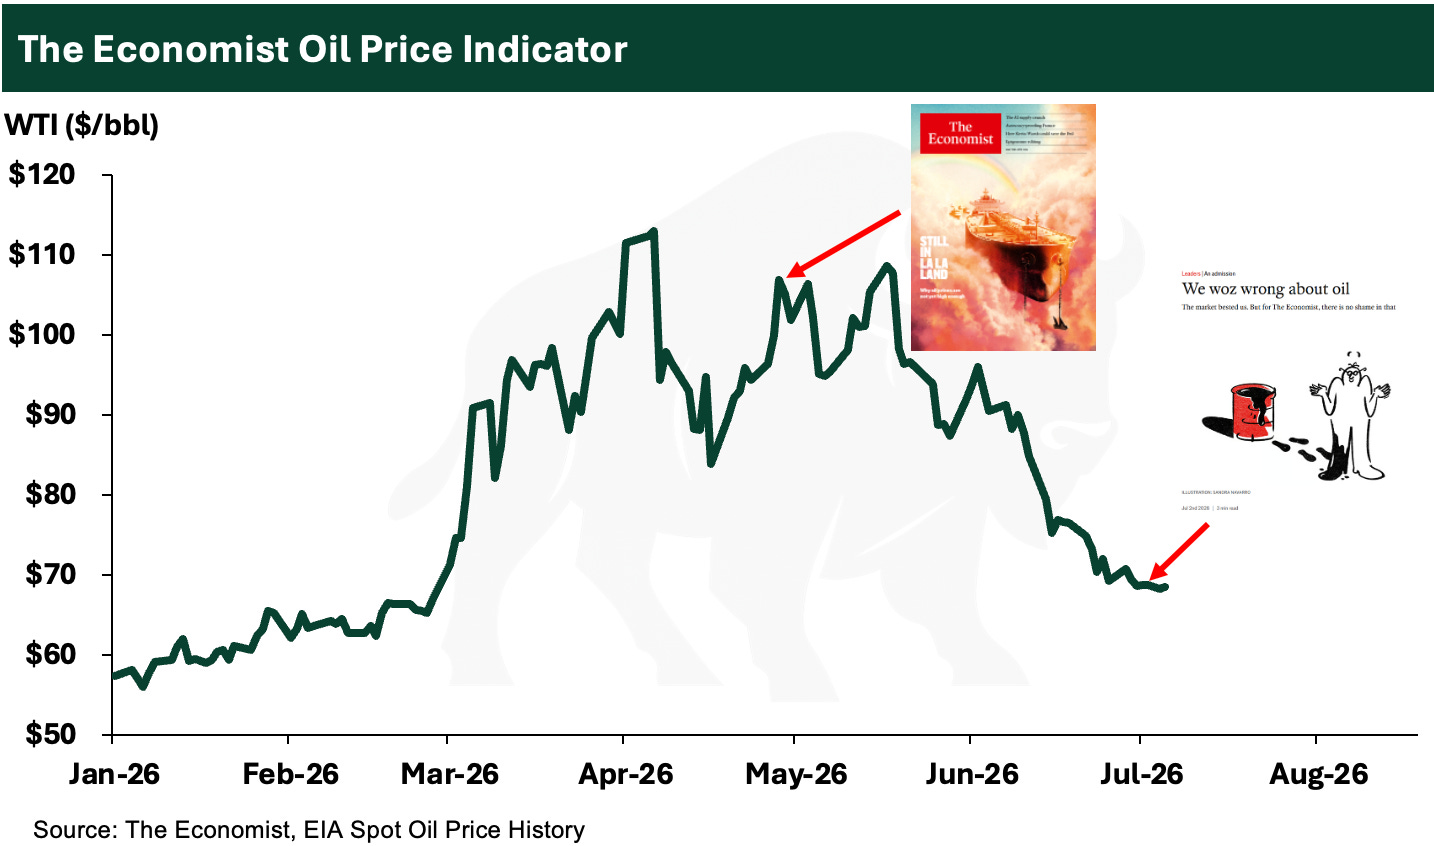
The Economist “indicator” is a somewhat humorous example, but it is useful in gauging oil market sentiment preceding major turning points.
What I find more reliable is a signal that combines this kind of sentiment read with actual physical-market data. The indicator I’m highlighting in this article does that: it is rarer, tied directly to the physical oil market, and has historically appeared near moments of extreme pessimism. Each prior episode was followed by strong outperformance from oil stocks.
Below, I walk through the signal that just flashed, what happened the last few times, and how it fits with my broader oil market fundamental view.
Disclaimer: This is for informational and educational purposes only. This is not an offer, solicitation, or investment recommendation. Please consult an advisor and do your own diligence. Past performance is not indicative of future results.
